


Introduction: The Margin Leak You Don’t See Coming
The culprit is almost always the same: actual vs theoretical food cost.
This gap doesn’t show up loudly. It doesn’t break suddenly. It leaks slowly, quietly, and expensively until scale magnifies the problem. For multi-unit operators juggling rising labor costs, tighter regulations, and PE-level reporting expectations, understanding this variance isn’t optional anymore. It’s survival.
What Is Food Cost Variance?
At scale, variance is where operational reality diverges from spreadsheet optimism. To get a bird’s-eye view of how these costs play into your overall financial health, it’s helpful to understand their role in The Ultimate Guide to Restaurant Prime Cost, which covers the critical balance between food and labor expenses.
Actual Food Cost: The Brutal Honesty of Your Bank Account
How Actual Food Cost Is Calculated
Beginning Inventory + Food Purchases – Ending Inventory = Actual Food CostWhat Actual Food Cost Captures
- Vendor invoices and credits
- Price volatility and substitutions
- Waste, spoilage, and expired product
- Theft, comps, and untracked usage
- Inventory counting errors
“What did we really spend?”
According to the USDA Food Price Outlook for 2025, wholesale food prices remain 3–5% higher than pre-2020 norms, with proteins and dairy showing the most volatility. Translation: your actual food cost is more unpredictable than ever, and hoping for the best isn’t a strategy. Managing this spend effectively often requires a deep dive into how long your cash is sitting on shelves; you can explore this further in our guide on Days Inventory Outstanding (DIO) for Restaurants.
Theoretical Food Cost: What Should Have Happened
How Theoretical Food Cost Is Calculated
Menu Item Sales × Recipe Cost per Item = Total Theoretical Food CostLet’s say you sold 100 brisket tacos last week. Your recipe card says each taco should cost $2.40 in ingredients. Your theoretical food cost for those tacos is $240. That’s what should have happened in a world where systems work perfectly.
What Theoretical Food Cost Relies On
- Locked, accurate recipes with yields
- Updated ingredient pricing
- Portion control discipline
- POS-to-recipe integration
- Clean menu engineering
“If the system worked exactly as designed, what should food have cost?”
“We thought our recipes were dialed in,” says Maria Chen, Regional Director for a 23-unit fast-casual chain in the Southeast. “Then we discovered our Atlanta locations were using a different queso recipe than our recipe book because the first GM trained everyone differently. Nobody caught it for 18 months.”
In growing chains, this “perfect world” becomes harder to maintain with every new unit, manager, and market. If you want to see how your current numbers stack up against this ideal, try running your figures through our interactive Food Cost Calculator to master your percentages in real-time.
Actual vs Theoretical Food Cost Variance Explained
Food Cost Variance Formula
Actual Food Cost – Theoretical Food Cost = Food Cost VarianceVariance Percentage Formula
(Variance ÷ Theoretical Food Cost) × 100A positive variance means food costs are higher than expected—usually without anyone noticing until month-end, when it’s too late to fix.
Visualizing Food Cost Variance
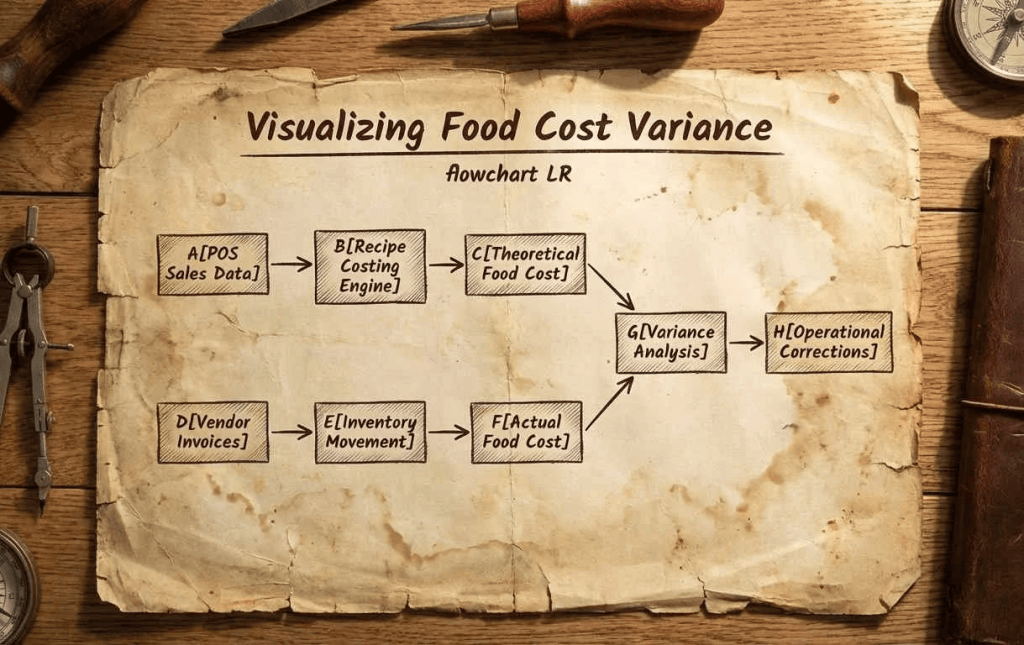
Food Cost Variance Flowchart
A [POS Sales Data] > B [Recipe Costing Engine] B > C [Theoretical Food Cost] D [Vendor Invoices] > E [Inventory Movement] E > F [Actual Food Cost] C > G[Variance Analysis] F > GG > H [Operational Corrections]What Causes Food Cost Variance in Restaurants?
1. Recipe Drift (a Silent Killer)
Six months later, your portions are 30% heavier than they should be, and nobody can figure out why food costs are climbing. Recipe drift is particularly insidious because it feels like hospitality, giving guests more value. But you’re actually just giving away your margins.
- Over-portioning during rushes
- “Veteran” cooks freelancing recipes
- Inconsistent prep across locations
2. Inventory Breakdowns
Inventory errors compound. Miss a case of chicken this week, and your variance spikes. Overcount next week to compensate, and now your trend line is meaningless. Rushed counts, incorrect units of measure, and receiving product without verification all create phantom variance that makes good data impossible.
- Missed or rushed counts
- Incorrect units of measure
- Receiving without verification
3. Vendor Price Whiplash
Your recipe says chicken breast costs $3.20 per pound. But your vendor raised it to $3.85 six weeks ago, and nobody updated the system. Now your theoretical food cost is based on fantasy numbers, and your variance looks terrible even though your team is executing perfectly.
- Invoice price changes, not reflected in recipes
- Substitutions without approvals
- Missed contract pricing
According to the National Restaurant Association’s 2025 State of the Industry Report, 82% of operators cite food costs as their top operational challenge, surpassing labor for the second year in a row.
Source: National Restaurant Association, 2025 State of the Restaurant Industry
4. Waste and Spoilage
Overproduction driven by terrible forecasting. Poor FIFO execution that turns $800 of produce into compost. Par levels set once during your opening week and never revisited even though your business has doubled. Walk-in temperatures that drift by three degrees, cutting shelf life in half.
Waste is expensive, common, and almost entirely preventable with proper systems. But it requires someone to care enough to measure it, track it, and fix it. Most operations just accept waste as “part of the business” and wonder why margins are tight.
- Overproduction driven by bad forecasting
- Poor FIFO execution
- Par levels set once—and never revisited
Tackling these inefficiencies is a massive win for your bottom line. For a deep dive into fixing these leaks, check out The Ultimate Guide to Reducing Food Waste in Restaurants.
5. Theft and Shrinkage
Unlogged comps because a regular complained. Staff meals that aren’t tracked. A cook who takes home a steak “just this once” that becomes every Friday. Shared inventory access with no audit trail. Bartenders over-pouring for better tips.
In single-unit operations, owners notice. In multi-unit environments, this stuff happens in pockets, usually at your weakest locations with your least engaged managers. Variance analysis helps you find exactly where.
- Unlogged comps or staff meals
- Shared inventory access
- No audit trail
In multi-unit environments, these issues rarely happen everywhere, but variance helps you find where. Don’t forget that the bar is often a major source of unrecorded shrinkage; you can get a handle on your liquid assets by using our Liquor Cost Calculator for Bar Profit.
What Is an Acceptable Food Cost Variance?
Best-performing restaurant groups generally aim for:
- 0%–2%: Tight control
- 2%–4%: Needs attention
- 4%+: Immediate intervention
For a 25-unit brand doing $2.5M per unit annually, a 1% variance swing equals $625,000 a year. That’s not noise. That’s EBITDA.
How to Reduce Actual vs Theoretical Food Cost Variance
Standardize Recipes at Scale
- Lock recipes and yields centrally
- Audit adherence by location
- Train with visual portion standards
Tighten Inventory Discipline
- Weekly cycle counts on high-risk items
- Clear receiving procedures
- Separation of duties
Align Purchasing With Reality
- Update ingredient pricing automatically
- Flag invoice anomalies
- Enforce approved vendor catalogs
Review Variance Weekly, Not Monthly
- Weekly variance exposes patterns early
- Compare locations, not just totals
- Manage by exception, not gut feel
This shift—from reactive to proactive—is where scaled operators win.
Food Cost Variance by Restaurant Type
Different restaurant types run at different variance levels based on complexity, volume, and operational model:
- QSR (Quick Service): 1.5–3% variance. Tight recipes, limited menus, high volume. If you’re above 3%, something’s broken.
- Fast Casual: 2–4% variance. More complexity, more customization, more room for error.
- Full Service: 3–5% variance. Larger menus, more prep, more touches. Anything above 5% is a red flag.
- Multi-Concept (without controls): 2–6% variance. Complexity raises risk exponentially, but proper systems reduce it dramatically.
The pattern is clear: complexity creates variance, but systems eliminate it.
Why Food Cost Variance Beats Food Cost Percentage
Food cost percentage tells you where you landed.
Actual vs theoretical food cost tells you why.
Variance reveals:
- Location-level execution gaps
- Training failures
- Process breakdowns
- Data integrity issues
For PE-backed groups and operators in high-regulation states like CA, NY, and IL, variance analysis becomes the backbone of a Single Version of Truth—one that replaces spreadsheets, guesswork, and store-to-store firefighting.
Using Food Cost Variance to Scale Without Chaos
The most disciplined restaurant groups use variance as a strategic weapon. They compare units objectively to identify best operators and replicate winning behaviors. They protect margins during expansion by ensuring new locations don’t inherit bad habits. And they stop managing by driving store to store, instead leading strategically from real data.
That’s how you grow from 10 units to 50 without losing your mind or your margins.
As a recap, its important to:
- Compare units objectively
- Identify best operators
- Replicate winning behaviors
- Protect margins during expansion
It’s how leadership stops driving from store to store and starts managing strategically.
Key Takeaways
- Actual food cost reflects cash reality
- Theoretical food cost reflects operational intent
- Variance exposes execution gaps
- Weekly analysis protects margins
- Scale demands automation, not heroics
Conclusion
After more than 13 years supporting restaurant operators through growth, complexity, and change, we’ve learned one thing: margins don’t disappear overnight, they leak through unmanaged variance. When actual vs theoretical food cost is visible, automated, and trusted, leadership gains clarity instead of chaos.
That’s where teams like Over Easy Office quietly come in, helping restaurant groups centralize data, automate inventory and AP workflows, and turn platforms like Restaurant365 or Crunchtime into a true operational command center rather than just another system. Contact us today to streamline your inventory and purchases.
Because the goal isn’t just knowing your numbers, It’s trusting them enough to scale.


